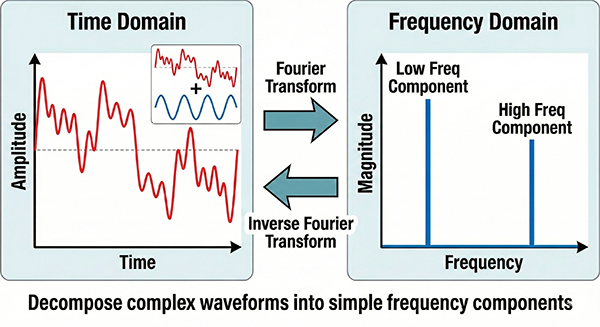
Fourier analysis is a mathematical technique that represents complex signals as the sum of simple waves (sine and cosine waves) with different frequencies.
Why is it important?
- Signal Decomposition: It allows you to analyze the frequency components contained in various signals like audio, images, and radio waves.
- Noise Reduction: You can remove noise within specific frequency bands or extract only the desired frequency components.
- Data Compression: It enables efficient data compression by reducing data based on the importance of frequency components (e.g., MP3).
- Image Processing: It’s applied in image edge detection and filtering, among other things.
Basic Concept
Let’s take a complex waveform as an example and compare it to the timbre of a piano sound. A piano’s timbre is created by multiple strings vibrating at different pitches. Fourier analysis is like analyzing the strength of each string (frequency) within that sound.
Types of Fourier Transforms
There are mainly two types:
- Fourier Transform (Continuous Fourier Transform, CFT): Transforms continuous signals into the frequency domain.
- Discrete Fourier Transform (DFT): Transforms digital data (discrete signals) into the frequency domain. Usually, DFT is used when dealing with computers.
Example: Fourier Analysis of an Audio Signal
Let’s analyze the frequency components of a simple audio signal using Fourier analysis.
- Audio Signal Acquisition: Obtain digital data representing the audio recorded by a microphone, etc.
- Sampling Rate: The rate at which the audio data is digitized (Hz). For example, 44.1kHz means acquiring 44,100 samples per second.
- DFT Transformation: Apply DFT to the acquired audio data and calculate frequency components.
- Spectrum Display: Display the calculated frequency components in a graph. The horizontal axis represents frequency (Hz), and the vertical axis represents amplitude (strength).
import numpy as np
import scipy.fftpack
import matplotlib.pyplot as plt

# Sampling rate (Hz)
sampling_rate = 44100

# Generate audio data (create multiple sine waves with different frequencies)
duration = 1  # seconds
frequencies = [200, 500, 800] # Hz
signals = []
for freq in frequencies:
    t = np.linspace(0, duration, int(sampling_rate * duration), endpoint=False)
    signal = np.sin(2 * np.pi * freq * t)
    signals.append(signal)

# Perform DFT on each signal and calculate the spectrum
spectra = []
for signal in signals:
    fft = scipy.fftpack.fft(signal)
    amplitude = np.abs(fft) / signal.size
    spectra.append(amplitude)

# Plot
plt.figure(figsize=(12, 6))  # Adjust the figure size
for i, (freq, spectrum) in enumerate(zip(frequencies, spectra)):
    frequency = np.fft.fftfreq(spectrum.size, d=1/sampling_rate)
    plt.plot(frequency, spectrum, label=f'{freq} Hz')

plt.xlabel("Frequency (Hz)")
plt.ylabel("Amplitude")
plt.title("Frequency Spectra of Multiple Signals")
plt.xlim(0, sampling_rate / 2)  # Display only positive frequency components
plt.grid(True)
plt.legend() # Show the legend
plt.show()
Execution Result:
Running the above code will display a spectrum with a peak around 500Hz. This indicates that the sine wave has a strong 500Hz frequency component.
Application to More Complex Signals
Actual audio signals are mixtures of multiple frequency components. By performing Fourier analysis, you can analyze the strength of each frequency component and understand the characteristics of the timbre.
Example: Instrument Timbre Analysis
Record audio from different instruments and perform Fourier analysis on each one. The shape of the spectrum will differ. For example, guitars tend to have more low-frequency components, while pianos tend to have more high-frequency components.
Summary
Fourier analysis is a very powerful tool in signal processing. You can easily perform Fourier analysis using programming languages like Python and libraries.
Additional Notes:
- Fast Fourier Transform (FFT): An algorithm for efficiently calculating DFT.
- Window Function: Used to reduce the effects of signals at the edges (e.g., Hamming window).
- Spectrogram: A representation method for visualizing time-varying frequency components.