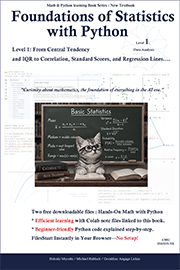
Math & Python Textbook Series
“Curiosity about mathematics,
the foundation of everything in the AI era.”
Level 1: From Central Tendency
and IQR to Correlation, Standard Scores, and Regression Lines….
Two free downloadable files : Hands-On Math with Python
Efficient learning with Colab note files linked to this book.
Beginner-friendly Python code explained step-by-step.
FilesStart Instantly in Your Browser—No Setup!
Contents
Chapter 1 What Is Statistics? — The Power to Think with Data
Chapter 2 Working with Data in Python
Chapter 3 Organizing Data into a Table
Chapter 4 Seeing Data with Graphs
Chapter 5 Measures of Center: Mean, Median, and Mode
Chapter 6 Seeing the Spread of Data: Range and Interquartile Range
Chapter 7 Variance and Standard Deviation: Putting Spread into Numbers
Chapter 8 Comparing Data with Ratios, Proportions, and Percentages
Chapter 9 T-scores and Standardization: Seeing Different Data on One Ruler
Chapter 10 Seeing the Relationship Between Two Variables: Scatter Plots
Chapter 11 Correlation: Variables That Rise and Fall Together
Chapter 12 Reading a Trend with a Straight Line: An Introduction to the Regression Line
Chapter 13 The Basics of Probability: Putting Likelihood into Numbers
Chapter 14 Experimenting with Probability in Python
Chapter 15 Samples and Populations: Thinking About the Whole from a Part
Chapter 16 An Introduction to Statistical Judgment: Chance or a Real Difference?
Appendix 1 Python Basics
Appendix 2 Python Libraries for Statistics
Purchase site (English version):Some sites only offer the digital version.
US (United States)