k-means clustering is an unsupervised learning algorithm used to partition a given dataset into several groups (clusters). It works by iteratively updating the “centroids” – the center points of each cluster – and assigning data points to the closest centroid.
Features:
- Simple and Fast: Relatively easy to compute, making it applicable to large datasets.
- Requires Parameters: The number of clusters (k) needs to be specified in advance.
- Initial Value Dependency: Results can vary depending on the initial selection of centroids.
- Strong for Convex Clusters: Good at finding spherical or circular clusters.
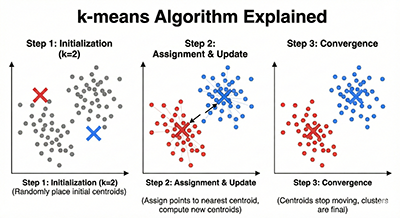
Steps of k-Means Clustering
- Initialization: Randomly select k centroids from the dataset as initial values.
- Assignment: Assign each data point to the cluster with the nearest centroid. Euclidean distance is often used to measure proximity.
- Update: Move each cluster’s centroid to the average position of the data points belonging to that cluster.
- Iteration: Repeat steps 2 and 3 until the cluster assignments no longer change, or a pre-defined maximum number of iterations is reached.
Let’s consider the following 2D dataset as an example:
(1, 2), (1, 4), (1, 0), (10, 2), (10, 4), (10, 0)
We want to cluster this data with k=2.
- Initialization: Randomly set the centroids to (1, 3) and (9, 3).
- Assignment: Calculate the distance from each data point to the centroids and assign it to the nearest cluster:
- (1, 2) -> (1, 3)
- (1, 4) -> (1, 3)
- (1, 0) -> (1, 3)
- (10, 2) -> (9, 3)
- (10, 4) -> (9, 3)
- (10, 0) -> (9, 3)
- Update: Calculate the centroids for each cluster:
- Cluster 1: ((1+1+1)/3, (2+4+0)/3) = (1, 2)
- Cluster 2: ((10+10+10)/3, (2+4+0)/3) = (10, 2)
- Iteration: Repeat steps 2 and 3 until the centroids no longer change or a maximum number of iterations is reached.
Finally, we would obtain the following clusters:
- Cluster 1: (1, 2), (1, 4), (1, 0)
- Cluster 2: (10, 2), (10, 4), (10, 0)
Python Code Example (using scikit-learn)
from sklearn.cluster import KMeans
import numpy as np

# Prepare the dataset
X = np.array([[1, 2], [1, 4], [1, 0], [10, 2], [10, 4], [10, 0]])

# Create a k-means model (k=2)
kmeans = KMeans(n_clusters=2, random_state=0, n_init='auto') #random_state fixes the initial values. n_init is specified to avoid warnings.

# Train the model
kmeans.fit(X)

# Get cluster labels
labels = kmeans.labels_
print("Cluster Labels:", labels)  # Output: [1 1 1 0 0 0]

# Get centroids
centroids = kmeans.cluster_centers_
print("Centroids:", centroids) #Output: [[ 1.  2.] [10.  2.]]

# Get the clusters
clusters = [[] for _ in range(2)]
for i, label in enumerate(labels):
    clusters[label].append(X[i])

print("Cluster 1:", clusters[0]) #Output: [[1 2] [1 4] [1 0]]
print("Cluster 2:", clusters[1]) #Output: [[10 2] [10 4] [10 0]]
Important Notes
- Choosing the value of k: The value of k should be determined appropriately using metrics such as the Elbow Method or Silhouette Analysis.
- Data Standardization: If the data scales are different, standardizing the data can yield better results.
- Addressing Initial Value Dependency: It’s recommended to train with multiple initializations and select the best result.
k-means clustering is a simple and fast clustering algorithm, but it’s important to be mindful of parameter selection and initial value dependency. Libraries like scikit-learn make implementation easy.
Euclidean Distance Explained
It’s a way to measure the “straight-line distance” between two points.
- In a plane (2 dimensions): It’s calculated using the Pythagorean theorem. For example, the distance between two points (x1, y1) and (x2, y2) is √((x2-x1)² + (y2-y1)²).
- In space (3 or more dimensions): You sum the squares of the differences in each coordinate axis and then take the square root.
Real-life image: It’s similar to measuring the shortest distance between two locations on a map.
Applications: Used in various fields such as data analysis in machine learning (clustering, etc.), image processing, robotics, and more.