Logistic regression is a machine learning algorithm used to solve classification problems. It’s particularly well-suited for binary classification (problems where the outcome is either 0 or 1). For example, it’s appropriate for predicting whether an email is spam or not, or if a customer will purchase a product.
1. Basic Idea of Logistic Regression
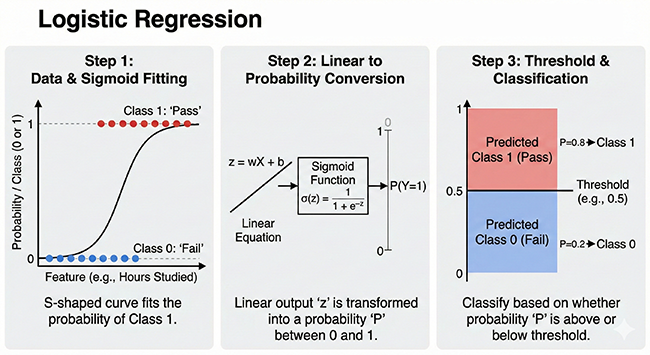
Logistic regression uses a function called the sigmoid function to predict values between 0 and 1 from input data. This value can be interpreted as the probability of an event occurring.
- Linear Combination: First, we multiply the input data by weights and add a bias. This is the same as in linear regression.
z = w1 * x1 + w2 * x2 + ... + wn * xn + bHere,x1, x2, ..., xnare the input data,w1, w2, ..., wnare the weights, andbis the bias. - Sigmoid Function: Next, we input the result of the linear combination into the sigmoid function.
y = 1 / (1 + exp(-z))The sigmoid function approaches 1 as the input value increases and approaches 0 as the input value decreases. - Probability Interpretation: The output
yof the sigmoid function represents the probability of an event occurring. For example, ify = 0.8, it can be interpreted as “this data has an 80% chance of being class 1 (e.g., spam email).” - Threshold Setting: Finally, we determine the final classification result based on whether the predicted probability is greater than a set threshold (usually 0.5).
y >= 0.5then class 1y < 0.5then class 0
2. Learning Method
In learning logistic regression, we adjust the weights w and bias b to minimize a loss function. The commonly used loss function is cross-entropy error.
- Cross-Entropy Error: This represents the discrepancy between the predicted probability and the actual label.
J = - (1/N) * Σ [y_i * log(p_i) + (1 - y_i) * log(1 - p_i)]Here,Nis the number of data points,y_iis the actual label (0 or 1), andp_iis the predicted probability. - Gradient Descent: To minimize the loss function, we use an optimization algorithm called gradient descent. Gradient descent iteratively adjusts the weights and bias in the direction of the gradient (slope) of the loss function, reducing the loss.
3. Example: Spam Email Classification
For example, consider predicting whether a new email is spam using the following data:
| Number of “free” words in the email body | Number of “limited” words in the email body | Is it spam? (0: No, 1: Yes) |
| 2 | 1 | 1 |
| 1 | 0 | 0 |
| 3 | 2 | 1 |
| 0 | 1 | 0 |
We learn this data with logistic regression and predict whether a new email is spam.
4. Python Code Example (using scikit-learn)
import numpy as np
from sklearn.linear_model import LogisticRegression

# Data preparation
X = np.array([[2, 1], [1, 0], [3, 2], [0, 1]])  # Input data
y = np.array([1, 0, 1, 0])  # Labels

# Create and train the logistic regression model
model = LogisticRegression()
model.fit(X, y)

# Prediction
new_email = np.array([[2, 0]])  # Feature vector of a new email
prediction = model.predict(new_email)

print("Prediction result:", prediction)  # Output: [1] (predicted as spam email)

# Probability output
probability = model.predict_proba(new_email)
print("Probability of being spam:", probability[0][1]) #Output:0.864...
5. Summary
Logistic regression is a simple yet powerful classification algorithm. It can be easily implemented using libraries like scikit-learn.
Note:
- The above code uses default settings, but you can adjust parameters of
LogisticRegression()to change the strength of regularization terms and thresholds. - Logistic regression works well for linearly separable data, but its performance may decrease for non-linear data. In that case, consider adding polynomial features or other algorithms (e.g., support vector machines or neural networks).