The Mathematics of the Mandelbrot SetThe Mandelbrot set is a famous example of Chaos Theory and fractal geometry.
Python code for the Julia Set
Python Implementation for Julia Set
This script generates a classic, aesthetically pleasing Julia set using
import numpy as np
import matplotlib.pyplot as plt
def generate_mandelbrot(h, w, max_iter=100):
"""
Computes the Mandelbrot set.
h, w: Resolution of the image
max_iter: Maximum number of iterations
"""
# Define the complex plane range (Real: -2.0 to 0.8, Imaginary: -1.4 to 1.4)
y, x = np.ogrid[-1.4:1.4:h*1j, -2:0.8:w*1j]
c = x + y*1j
z = c
# Array to keep track of the iteration count when a point diverges
divtime = max_iter + np.zeros(z.shape, dtype=int)
for i in range(max_iter):
z = z**2 + c
# Check for divergence (absolute value > 2)
diverge = z * np.conj(z) > 2**2
div_now = diverge & (divtime == max_iter) # Points diverging for the first time
divtime[div_now] = i # Record the iteration number
z[diverge] = 2 # Avoid overflow issues
return divtime
# Configuration
width, height = 1000, 1000
max_iter = 100
# Generate the set
mandelbrot_set = generate_mandelbrot(height, width, max_iter)
# Plotting with matplotlib
plt.figure(figsize=(10, 8))
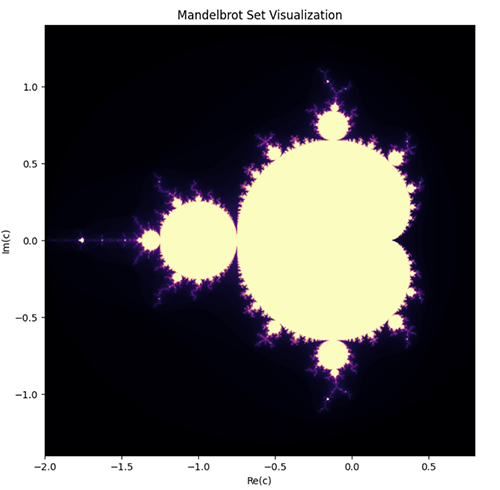
plt.imshow(mandelbrot_set, extent=[-2, 0.8, -1.4, 1.4], cmap='magma')
plt.title('Mandelbrot Set Visualization')
plt.xlabel('Re(c)')
plt.ylabel('Im(c)')
plt.colorbar(label='Iterations until divergence')
# Show the result
plt.show()